The topography of Mars is one hundred times more familiar to us than the topography of our own ocean floors.
While the surface of Mars has been surveyed and mapped out by satellites, two-thirds of our planet is hidden under deep bodies of water. In the past, ships designed to scan the depths of the oceans have provided high-resolution images of small sections of the sea floor. But these ships can travel at no more than 12 miles per hour, so it would take decades for one of them to cover the entire base of the oceans.
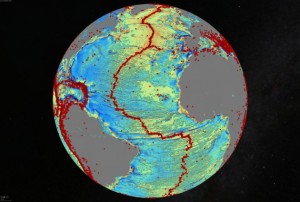
Now, a new technique hinged on the interaction between underwater topographical features and satellites has been used to create an amazingly detailed seafloor map. Exciting, never-before-seen underwater features such as ridges and volcanoes can now be explored by anyone. Satellite technology from NASA and other space agencies was utilized in a new way to develop this map of the seafloor, which is sure to benefit a variety of scientific fields, including geology and oceanography. In addition, the new technique of gravity mapping has significant implications in research endeavors. The interactive, 3D map was created by David Sandwell and the Scripps Institution of Oceanography, and is accessible to the public at wired.com, among other scientific websites.

Image Courtesy of David Sandwell.
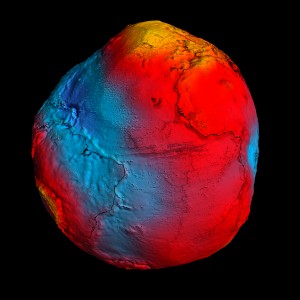
Though the ocean appears flat from a ship or an airplane, large underwater concavities and elevations create enough gravitational force to pull the water down at the surface. The resulting bumps and dips can be detected by a satellite. In building the 3D seafloor map, Sandwell’s team analyzed data from two satellites operated by NASA, the French space agency CNES and the European Space Agency. Though these satellites were originally launched in 2009 to monitor global ocean circulation and sea ice levels, they have also collected enough seafloor data to construct this map. Unlike gravitational maps created by older satellites, this map utilizes the higher sensitivity of new satellites to pinpoint smaller, previously unobserved details.

Image Courtesy of Fox News.
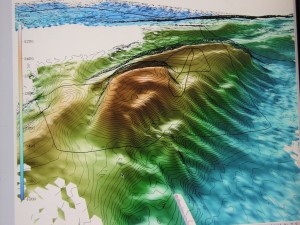
Geologists will be able to use this highly-detailed map to further track the shifting of the crustal plates that created modern continents. Joanne Whittaker, a marine geologist at the University of Tasmania in Australia, is particularly excited about the development of this map because the Indian and Southern Oceans around the Australian continent have thus far been poorly surveyed. Whittaker is currently planning a research voyage to explore the Gulden Draak Knoll, an underwater fragment of what may have been an ancient microcontinent, and gravity maps will definitely come in handy.
The map also aids commercial interests of oil and gas companies. Using the 3D map, scientists can pinpoint areas potentially rich in petroleum. An extinct spreading ridge, or a fracture point in the Earth’s crust into which molten mantle rises, has been discovered in an area of heavy oil exploration off the coast of Brazil. Given increasing energy consumption by the human race, any discoveries of new oil sources are crucial.
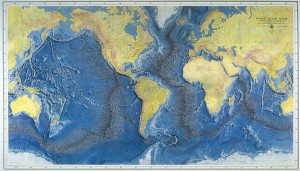
Furthermore, scientists can use the detailed map to gain a better understanding of the tectonic processes underlying devastating natural disasters such as tsunamis and earthquakes. Large earthquakes are powerful enough to alter the gravitational field in the surrounding area, which can be captured in images by the same satellite technology used in the Scripps team’s investigation. Scientists can compare images of the ocean floor before and after an earthquake. This way, they will better understand the mechanism of earthquakes and of other natural disasters. Scientists were amazed that satellites captured a notable change in the gravitational pull off the coast of Japan following the 2011 Fukushima earthquake.

Image Courtesy of Columbia University.
Of course this amazing development in technology and oceanography comes with certain limitations. Though these new satellites are capable of producing maps at much higher resolutions, uncovering smaller features, such as the lost Malaysia Airlines flight MH370, requires research ships. Ships are able to capture more precise details of the ocean floor – albeit, smaller subsections of the ocean floor. Additionally, analyzing raw data from the satellites is a tedious process. Researchers spend hours sifting through the feedback, pinpointing alterations in gravitational pull that may correspond to differences in concavity. The process still lacks total accuracy.
However, these recent improvements have shown just how much potential there is to the technique of gravity mapping. Soon enough, the topographic features of the ocean floor might be just as familiar to us as those we easily recognize on a map of our planet.

Image Courtesy of Expedition USF.
